|
|
|
Presented here is an example of a complete solution of a transonic flow for the RAE2822 airfoil.
This test case is the commonly used reference case with an onflow mach number of Ma=0.729 and an angle of
attack of a=2.31 at standard sea level ISA conditions (p=101000 N/m^2, T=286.11 K).
A good write-up along with reuslts from another CFD-code can be found at the
NPARC Alliance Validation Archive.
Using a single block, structured euler o-grid of 160x49 nodes generated with
UGRID a total of 2500 4v-multgrid-cycles are performed until convergence is achieved.
This solver run is done using local time-stepping, a CFL number of 7.5, implicit residual smoothing with variable coefficients scaled with an
epsilon of 0.8, and 2nd and 4th order artificial viscosity terms scaled with factors of 0.5 and 1/64 respectively.
Total runtime for the 2500 iterations was just over 16 minutes on a Dell Inspiron notebook with a 1.6GHz P4-processor.
|
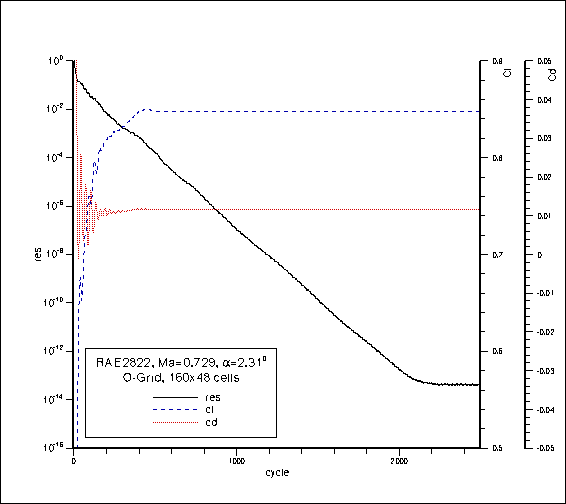
Logarithic plot of the density plot during the 2500 multigrid-cycles. Convergence to machine accuracy is achieved after about 2000 cycles.
The plotted development of the lift- and drag- as well as the moment coefficients attain a constant value much earlier, after about
500 cycles. Final values of the aerodynamic coefficients are cl=8.475e-001, cd=1.158e-002, and cm=-7.060e-002.
|
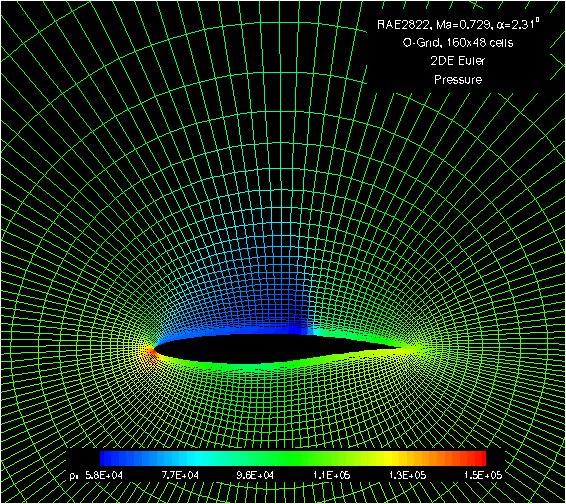
The O-Grid mesh in the vicinty of the airfoil is shown here with coloring reflecting the computed pressure distribution. The mesh consists
of 160x48 cells and the farfield boundary is located about 12 chord lengths from the airfoil.
|
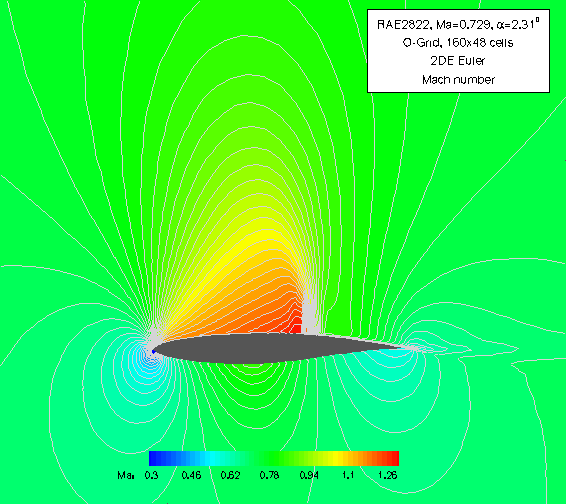
The 2D-contour plot of the mach number distribution shows the extent of the supersonic flow on the airfoil suction side, which is
terminated by a relatively strong recompression shock.
|
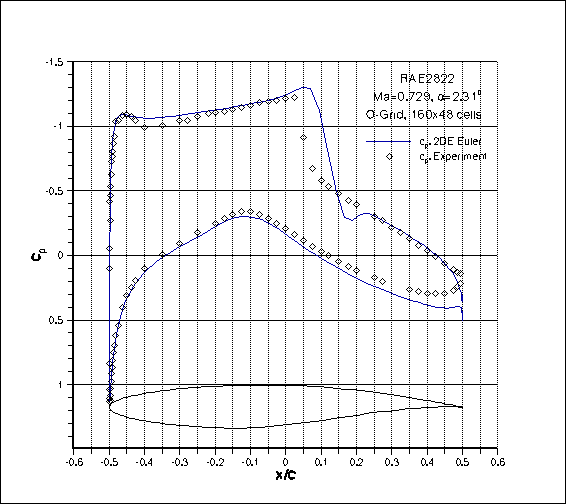
The steady-state cp-distribution on the upper and lower airfoil surfaces agree favorably with the experimental results found
in literature, although the shock is slightly overpredicted in strength and located slightly further aft of the experimentally
determined position. This is to be expected, as there is no decambering effect of the boundary layer present in an inviscid simulation.
|
|
|
|